CapitaLand Group
Our Businesses
Explore by Interest


All
Investment
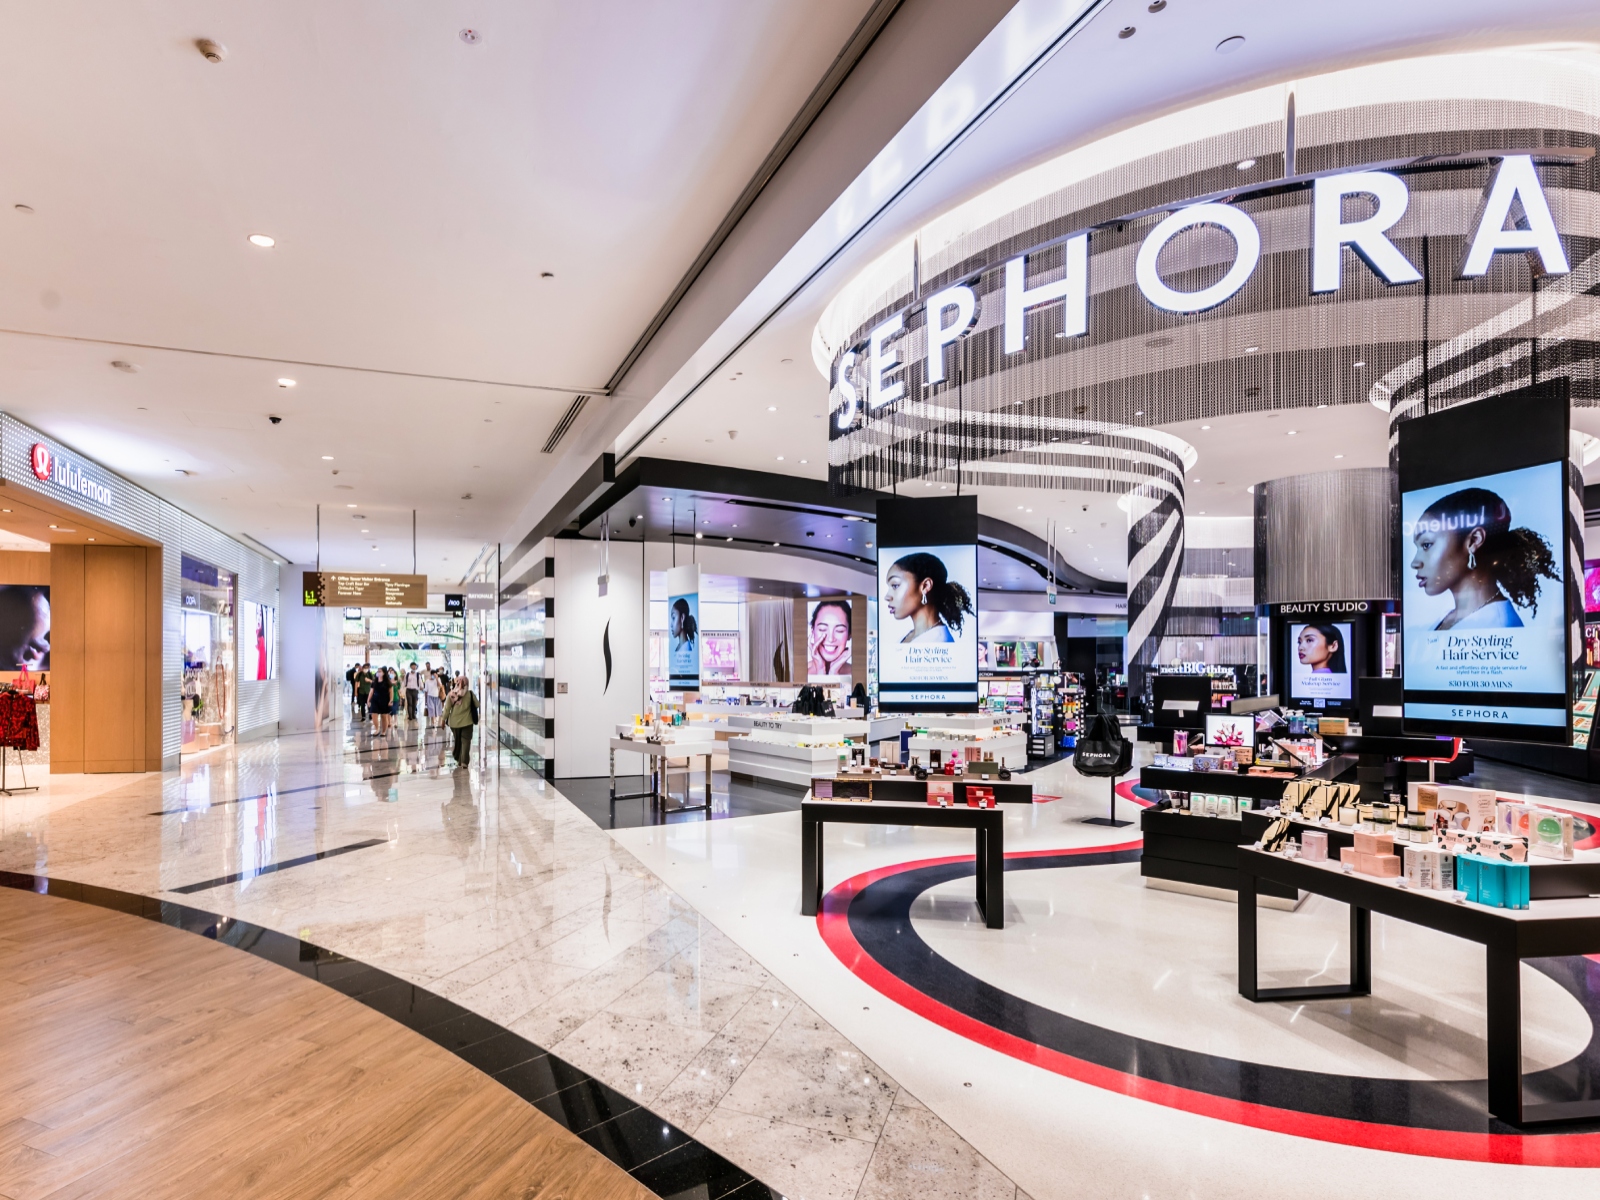
Shopping
Leasing
Lodging
Residential
CapitaLand Group
With a solid business ecosystem, we deliver long-term sustainable value to our stakeholders.
Explore CapitaLand


Fee Income-related Businesses


Our Portfolio

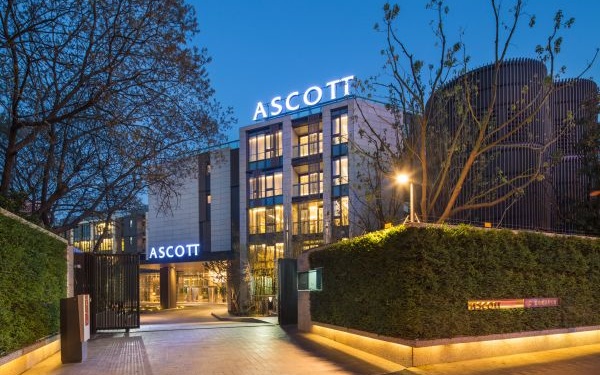
The Ascott Limited


Featured Properties


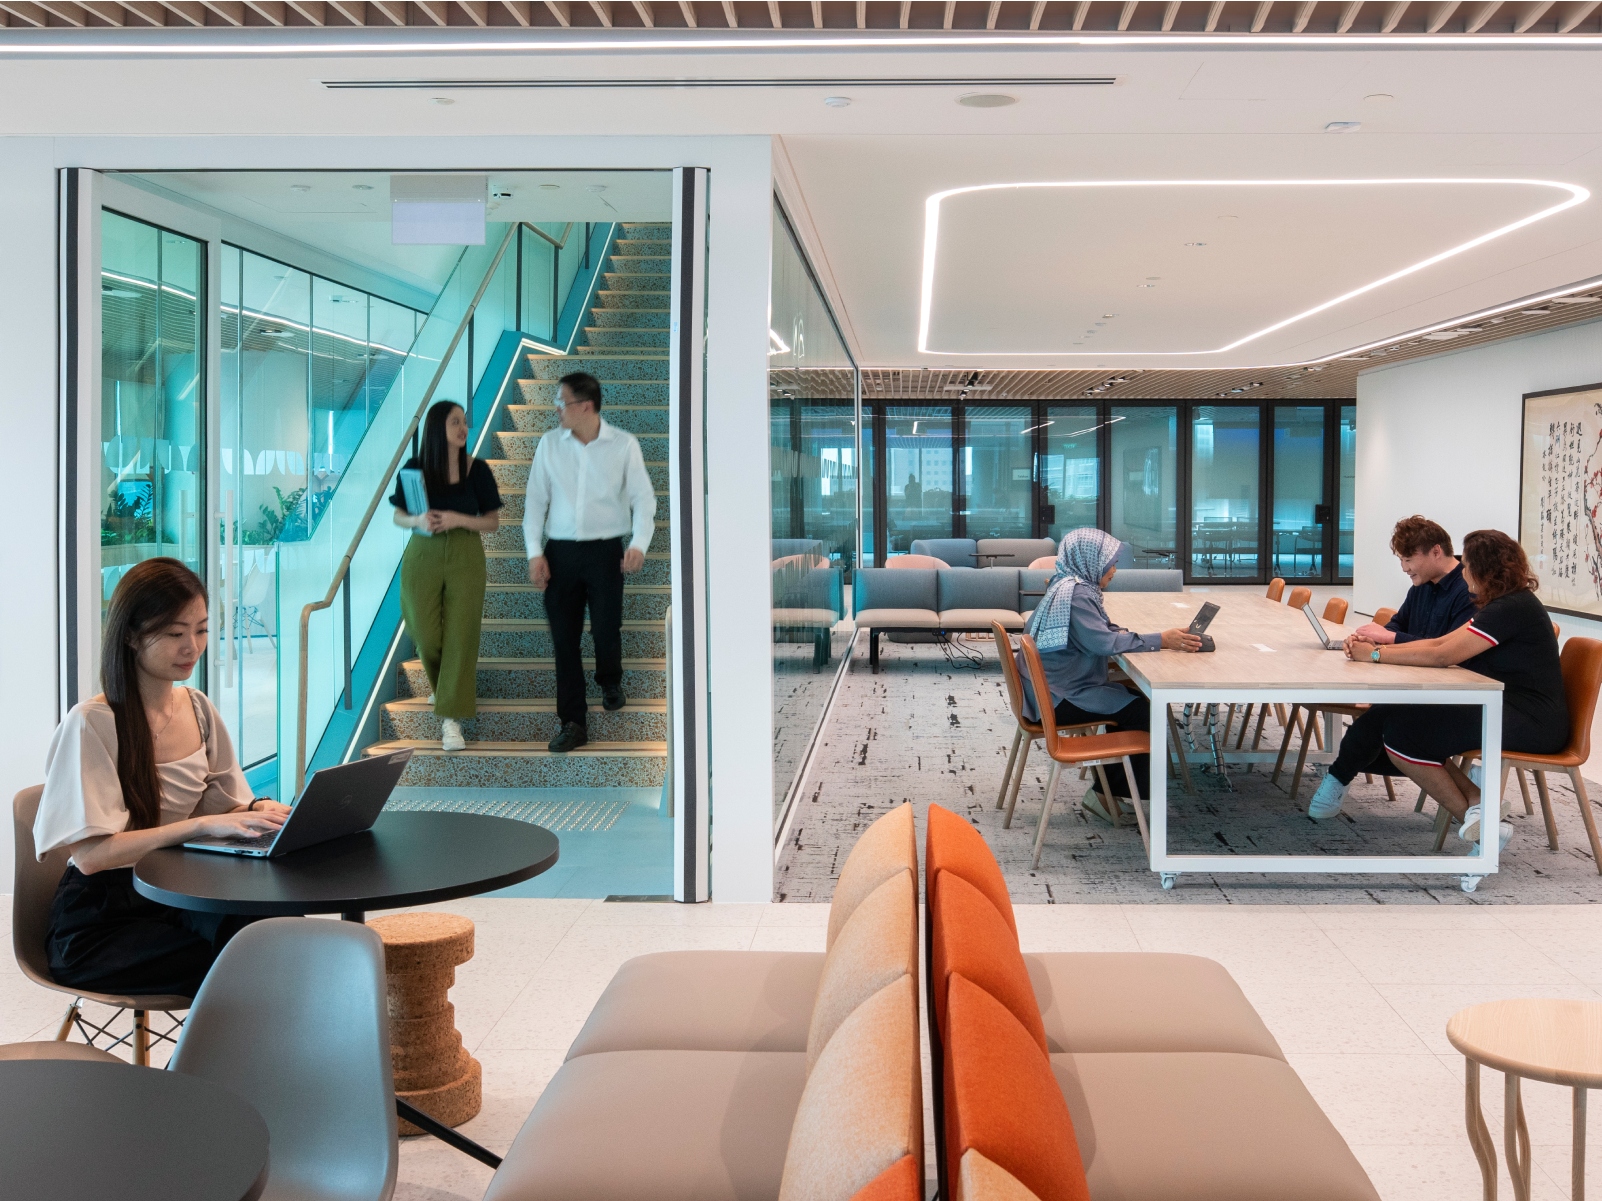
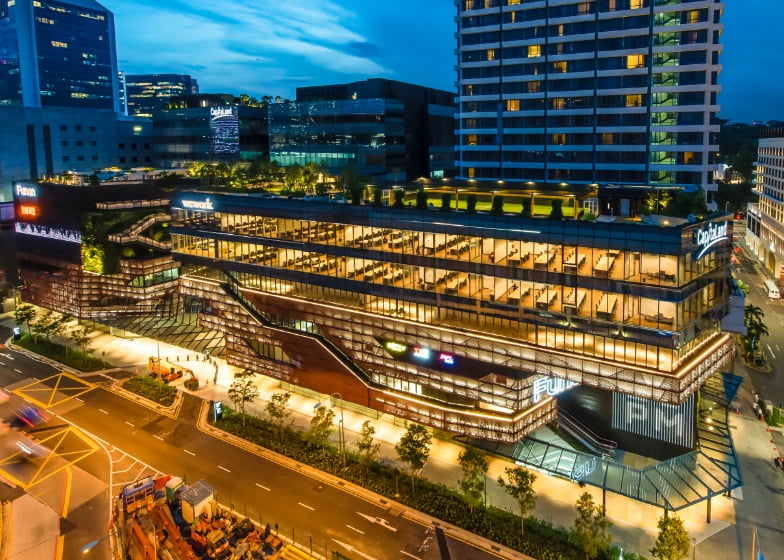
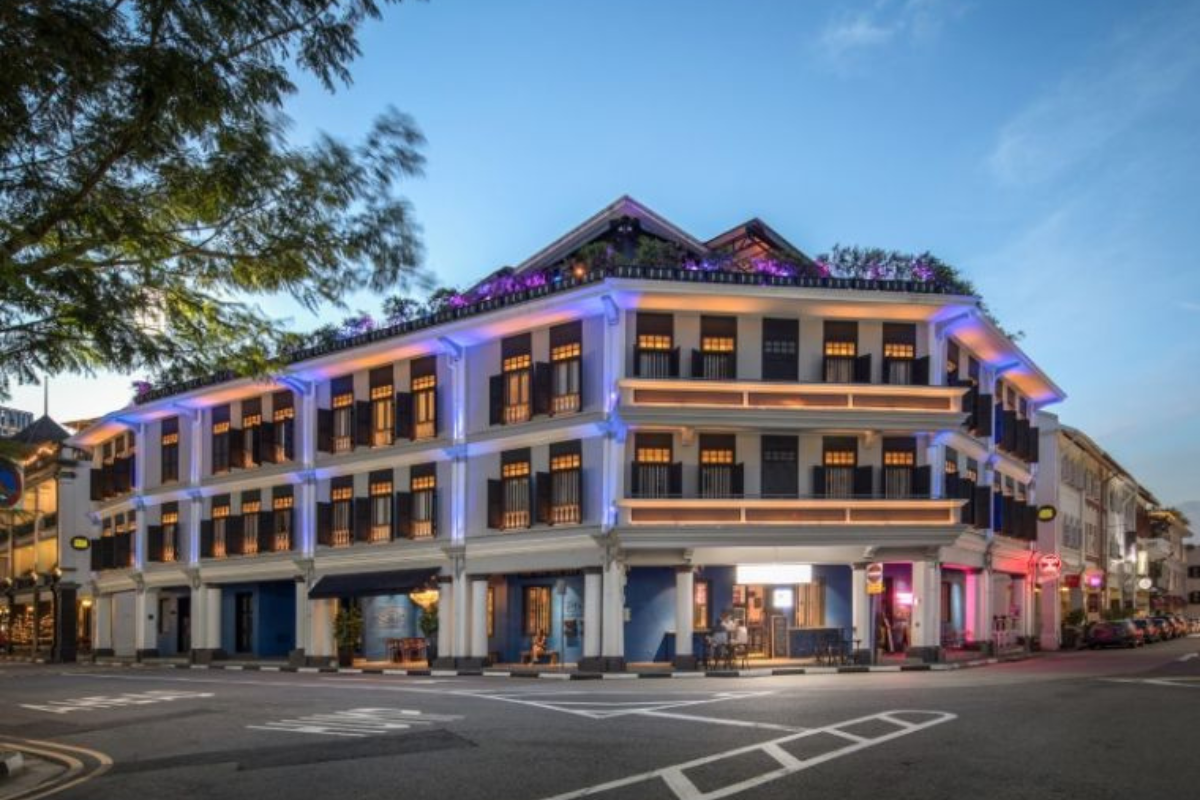
 lyf Funan Singapore
